Tap image to enlarge이미지를 누르면 크게 볼 수 있습니다
Application & Purpose작품의 목적
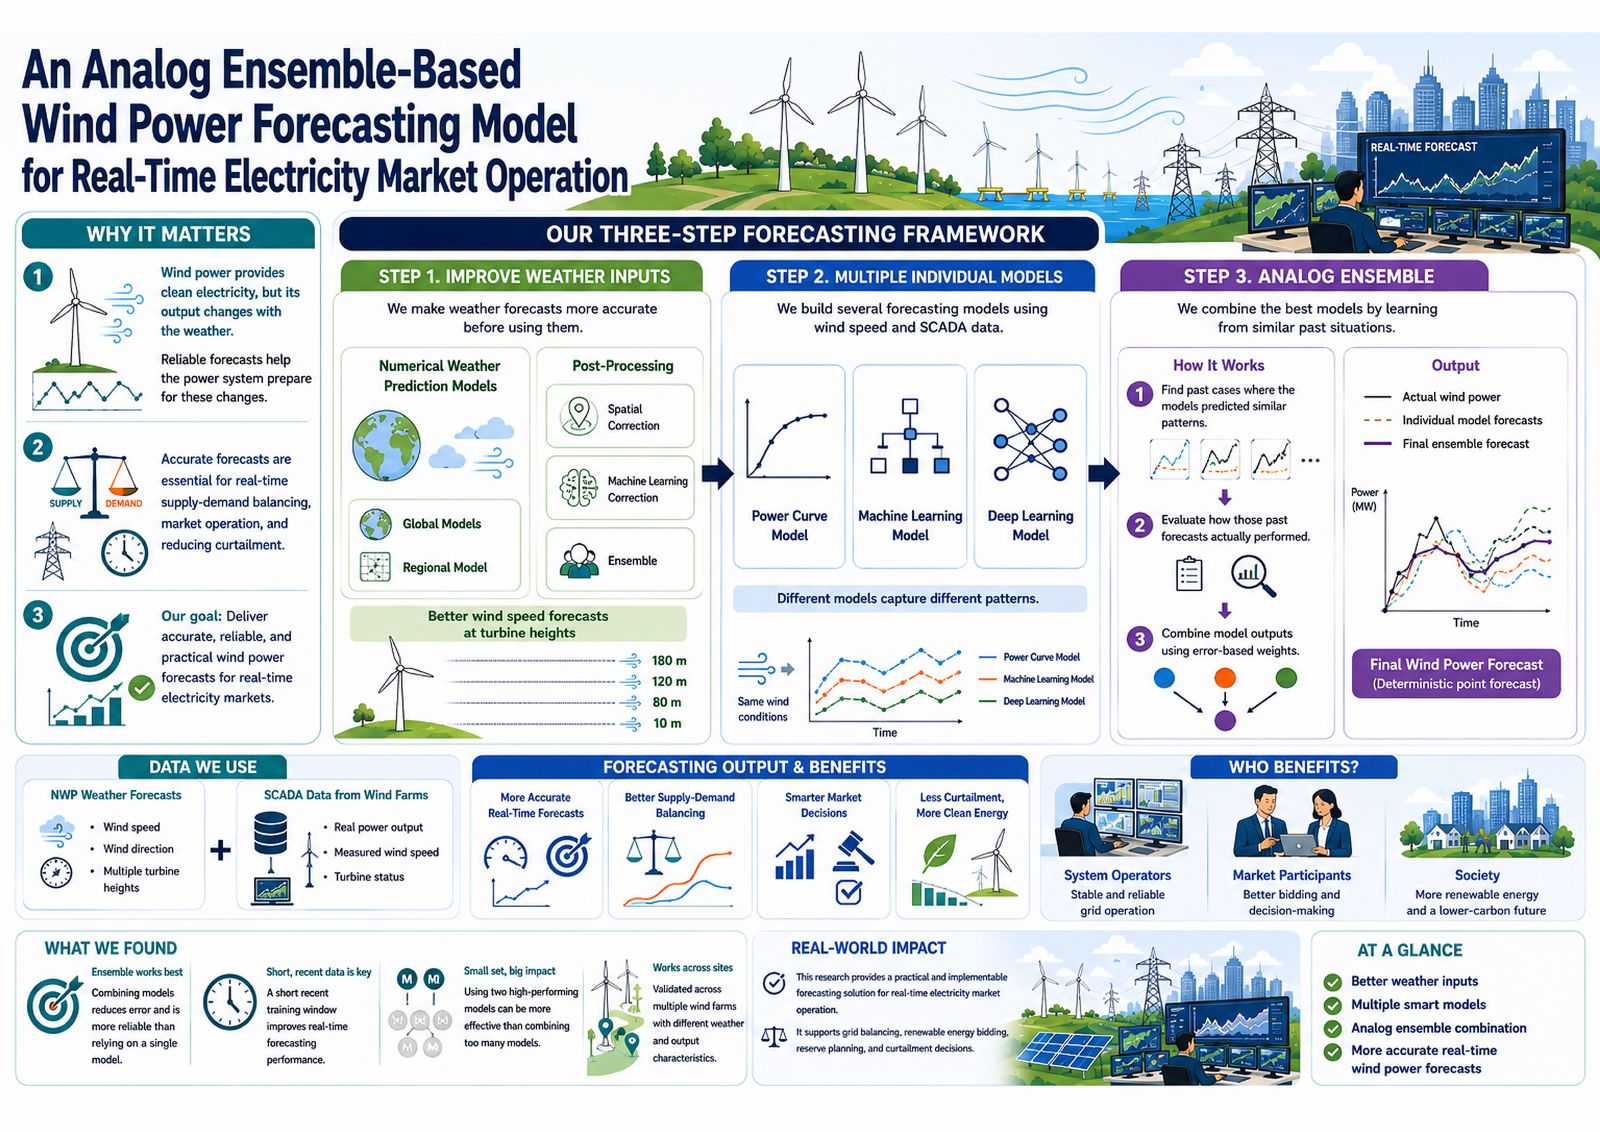
This visual abstract translates a technical wind-power forecasting framework into an accessible narrative for general audiences, policymakers, system operators, and market participants. It explains why weather-driven variability matters, how weather and SCADA data are processed through multiple models and an analog ensemble, and how improved forecasts can support grid balancing, market decisions, and reduced curtailment.
이 시각 초록은 기술적인 풍력 발전 예측 프레임워크를 일반 대중, 정책 입안자, 계통 운영자, 시장 참여자를 위한 접근하기 쉬운 서사로 옮깁니다. 기상에 따른 변동성이 왜 중요한지, 기상 데이터와 SCADA 데이터가 여러 모델과 아날로그 앙상블을 거쳐 어떻게 처리되는지, 개선된 예측이 계통 균형, 시장 결정, 출력 제한 감소를 어떻게 뒷받침하는지 설명합니다.
AI Tools & WorkflowAI 도구와 작업 흐름
I used ChatGPT to structure the scientific narrative, refine English labels, and generate the infographic through iterative image prompts. The final image was upscaled, sharpened, and converted into a single-page A3 PDF for print submission.
ChatGPT로 과학 서사를 구성하고 영문 라벨을 다듬고 반복적인 이미지 프롬프트로 인포그래픽을 생성했습니다. 최종 이미지는 업스케일하고 선명도를 높인 뒤 인쇄 제출용 단일 페이지 A3 PDF로 변환했습니다.
Process & Iterations제작 과정과 반복
I began by reducing the research report to four communication questions: why forecasting matters, what data are used, how the three-stage framework works, and who benefits. Early generations were visually rich but overcrowded and often reintroduced model names, uncertainty bands, or footer elements that had been intentionally removed. I therefore rewrote the prompt with strict inclusion and exclusion rules, simplified the individual models into three categories, shortened public-facing language, and repeatedly regenerated the composition. After selecting the clearest version, I checked the hierarchy, labels, safe margins, and reading flow, then produced an A3 landscape PDF. The final work balances technical accuracy with rapid visual comprehension.
연구 보고서를 네 가지 소통 질문으로 줄이는 데서 시작했습니다. 예측이 왜 중요한가, 어떤 데이터를 쓰는가, 3단계 프레임워크는 어떻게 작동하는가, 누가 혜택을 받는가. 초기 생성물은 시각적으로 풍부했지만 과밀했고, 의도적으로 제거한 모델명, 불확실성 구간, 푸터 요소를 자꾸 다시 넣었습니다. 그래서 엄격한 포함·제외 규칙으로 프롬프트를 다시 쓰고, 개별 모델을 세 범주로 단순화하고, 대중용 문구를 줄이고, 구성을 반복 재생성했습니다. 가장 명확한 버전을 고른 뒤 위계, 라벨, 안전 여백, 읽기 흐름을 점검하고 A3 가로 PDF를 만들었습니다. 최종 작품은 기술적 정확성과 빠른 시각적 이해의 균형을 맞춥니다.
A Researcher's Perspective연구자의 관점
As a power-systems researcher, I was surprised by how quickly AI could turn a forecasting pipeline into a coherent visual story. Its strength was rapid exploration of layout, metaphor, and iconography; its weakness was precise control of technical labels and omissions. AI image-making worked best when I treated prompting as iterative scientific editing rather than one-click generation. I would advise researchers to simplify their message first, define non-negotiable content, and verify every visual claim.
전력 계통 연구자로서 AI가 예측 파이프라인을 얼마나 빨리 일관된 시각 이야기로 바꾸는지 놀라웠습니다. 강점은 레이아웃, 은유, 아이콘의 빠른 탐색이었고, 약점은 기술 라벨과 누락에 대한 정밀한 통제였습니다. AI 이미지 제작은 프롬프팅을 원클릭 생성이 아니라 반복적인 과학 편집으로 다룰 때 가장 잘 작동했습니다. 연구자들에게는 먼저 메시지를 단순화하고, 타협할 수 없는 내용을 정의하고, 모든 시각적 주장을 검증하라고 권합니다.
Organized by주최·주관



Supported by후원
